Voltage |
EMA3D allows setting voltage distributed across geometry as an excitation source.
The locations of the voltage sources are specified by identifying geometry or nodes where the source is to be applied, with additional data provided to specify the source characteristics.
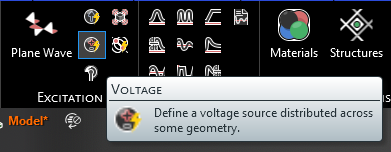
Click Voltage
 within the Excitation panel under the EMA3D tab in the Ribbon.
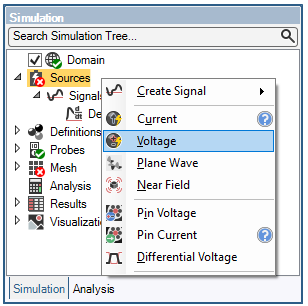
Alternatively, right click Sources in the Simulation Tree and select
 Voltage.
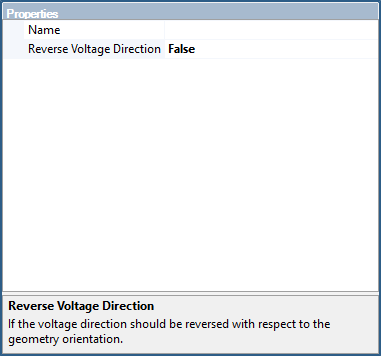
Adjust the properties of the voltage source in the properties panel. The list of adjustable properties and their definitions are provided in the table at the end of this page.
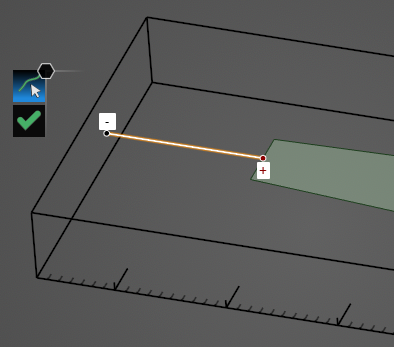
Click on the appropriate selection tool (i.e., line
 ) in the top left of the model window to restrict the voltage source assignment definition.
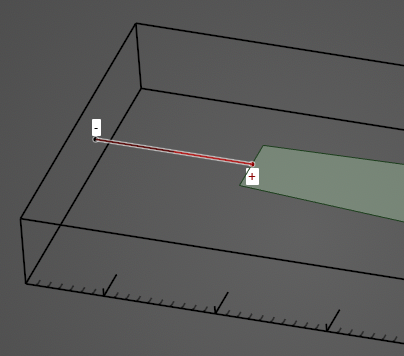
Click on the geometric entity to be excited. It will be highlighted. Note that the geometric entity used for the source should not have a material definition assigned to it.
Click OK
 to complete the voltage source setup.
The excited geometry will be recolored red and black in the model window (users may need to click elsewhere in the model window to remove the highlighting). The positive end of the excited geometry will be indicated by a red dot with a + symbol and the negative end will be indicated by a black dot with a - symbol.
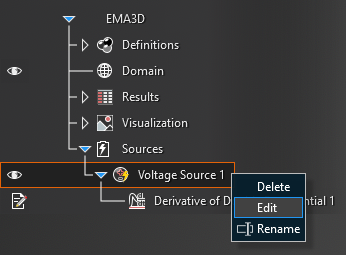
The voltage source will be added to the Simulation Tree under the Sources node as
Voltage Source. The yellow warning label attached to it indicates that the source needs a signal attached to it.
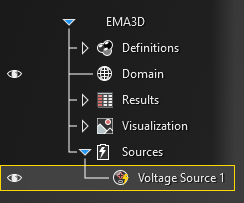
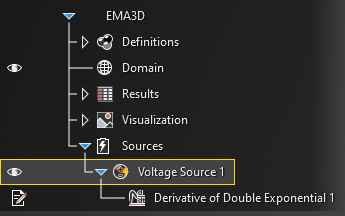
Instructions on adding signals can be found here. Once a signal is attached to the source, the yellow warning label will disappear.
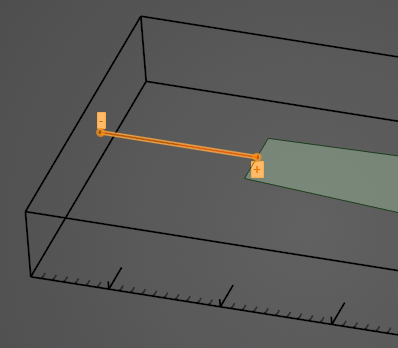
Selecting
Voltage Source in the Simulation Tree will highlight the source in the model window.
To edit the voltage source at any time, right click
Voltage Source in the Simulation Tree.
Entry | Meaning |
|---|---|
Name | The display name of the voltage source in the Simulation Tree |
Reverse current direction |
The voltage polarity is prescribed automatically depending on the direction in which the geometry was drawn. The voltage polarity for a line will be shown with red and black dots with +/- signs, respectively, near the source geometry after clicking the OK |
EMA3D - © 2025 EMA, Inc. Unauthorized use, distribution, or duplication is prohibited.