Internal Results |
With the raw data loaded, we can now make the subset data of the individual outputs (that are useful for the user).
With the raw 'charge_results' data loaded into the GUI in the Simulation Tree, right click theses results.
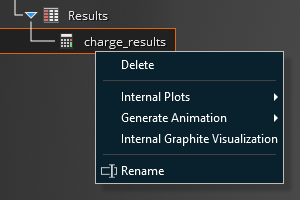
After right clicking 'charge_results' and hovering over Internal Plots, you will see 3 options to compute output data.
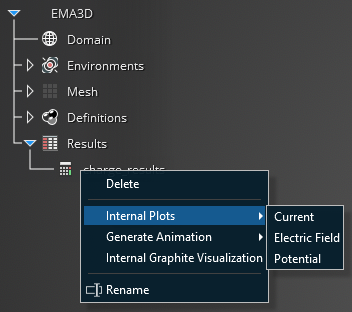
Compute calculates the average of theses of these paramteres for all materials, and this will be used to generate 2D plots that have a single min, max, and average value. This gives a broad picture of the general charging behavior of your entire model.
Current- Calculates the min, max, and average current across the geometry
E-Field- Calculates the min, max and average electric across the geometry
Potentials- Calculates the min, max and average potential across the geometry
Compute an option above right clicking 'charge_result' hovering over Internal Plot and clicking the target option.
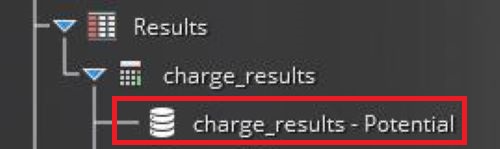
This will generate a data subset located in the Structure Tree under Results. When the data subsets are created in the GUI, this creates a .dat file in teh saved directory of the simulation with the name of the dataset created. If you navigate to this file and open it with a .txt viewer you will see the columns of the data computed, including the time steps giving the user the ability to manipulate and plot the data outside of the CHARGE GUI.
This option will be discussed in the Visualization section of the manual, along with how to generate and edit 2D plots of all the possible data subsets.
EMA3D - © 2026 EMA, Inc. Unauthorized use, distribution, or duplication is prohibited.