Visualization |
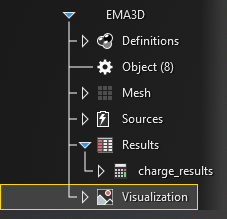
Visualization does not have a section in the CHARGE ribbon but rather in the Simulation Tree, and if you expand this section in the tree you can see a subsection for 2D plots. This section is concerned with making 2D plots of the formatted data from running simulations in CHARGE. Additionally, this section will cover creating animations. Continue to the sub-sections below for instructions.


EMA3D - © 2026 EMA, Inc. Unauthorized use, distribution, or duplication is prohibited.