2D Plots |
Here the user can look for instruction on how to generate, modify and export 2D plots in CHARGE. We are starting this section assuming the user has formatted the raw data as per the instructions in the Results section of this manual
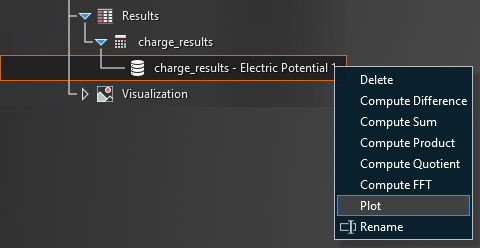
Navigate in the Simulation Tree to the Results section, where you have compiled results for the desired output of choice, be it potential, electric field, current etc. The example below has 'charge_results - Electric Potential' calculated and ready for plotting. Right click these results and select Plot
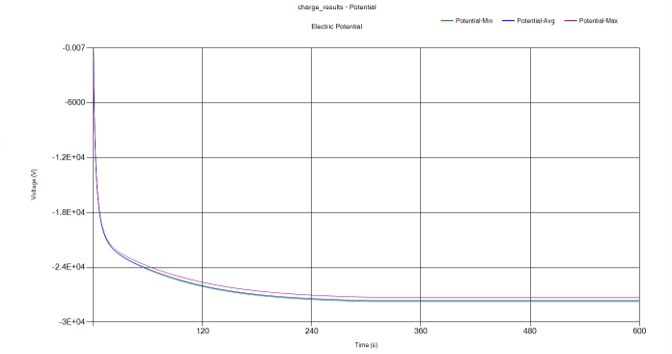
A plot will come up in its own model window with its own results tab, with the example shown below.
Now under the Visualization section in the Simulation Tree there is a 2D plots section that is now populated with a plot for the results you chose, in this case 'charge_results - Electric Potential'
![2DPlots 1[1]](../media/2DPlots1[1].png)
And as you can see you can expand this entry to see all the traces that are part of this plot i.e. Potential-Min, Max and Avg.
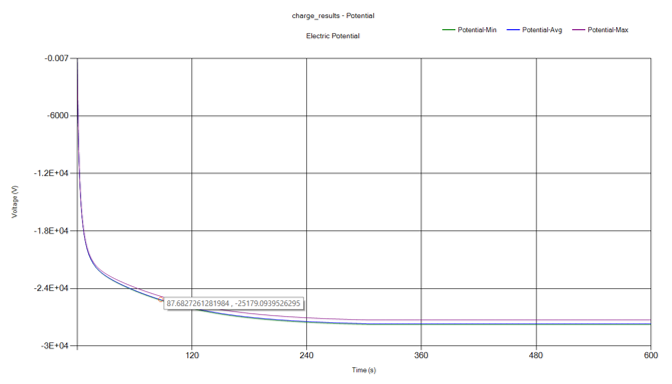
In the plot, you can hover your cursor over the individual traces to show the X and Y values.
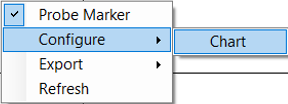
If desired this feature can be deactivated by right clicking in the plot area, where a pop up window will appear. Unchecking Probe Marker removes this feature.
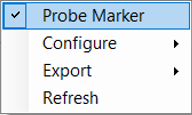
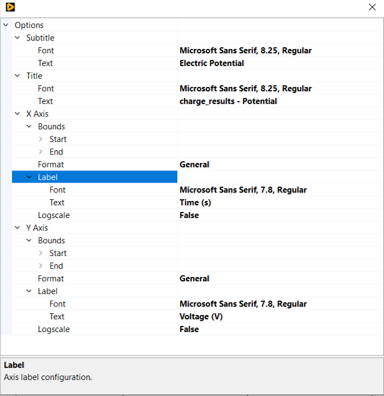
Also by right clicking within the plot in the pop up window there are some choices for modification of the plot. Right click within the plot area and select Configure -> Chart.
This will open up the Chart Options window, that has the various options to change the chart title and subtitle, along with the axis bounds and number format, labels and whether you want a log scale or not.
Modification the data trace lines can be done as well by right clicking the trace of choice in the graph legend, selecting Configure and there will be a selection for the name of the trace you selected with an example shown below.
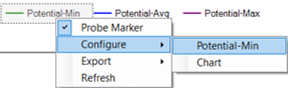
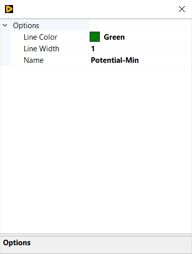
This will select the Trace Options menu, which simply allows the user to change the trace color, line width and the legend name. Make any changes you want to the trace and click the X in the top right of the menu to close it.
Traces can be removed from the plot by right clicking the trace in the 2D Plots section of Visualization in the Simulation Tree and selecting Delete.
The user can export the data and/or the images created. Right clicking in the plot area, bringing up the pop window, you will see and Export options.
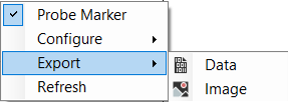
Selecting Data will open the browser window to export the data as a .csv, .txt or a .dat file of the traces plotted. This file will contain 2 columns for each trace exported, the 1st being the time steps of the data entries, and the 2nd the data itself of the trace.
If you select Export -> Image it will open up the browser window to save the image in the directory of choice in the format desired.
EMA3D - © 2026 EMA, Inc. Unauthorized use, distribution, or duplication is prohibited.