Visualization |
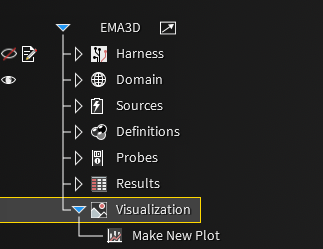
The Visualization node is located in the Simulation Tree and collects the plots that are produced from the EMA3D simulation outputs.
Information on plotting 2D plots of probe data and exporting calculated statistics can be found here, and information on plotting 3D plots of animation probe data can be found here.
Other Resources
EMA3D - © 2026 EMA, Inc. Unauthorized use, distribution, or duplication is prohibited.