Antenna Far Field |
Antenna far field data can only be plotted for one frequency and visualizations are not saved to the .dsco file. However, all frequency data is written to a text file in the results folder. The model can be re-opened and a new frequency can be plotted from this existing dataset without needing to re-run an EMA3D simulation.
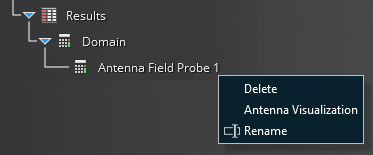
After the simulation has finished, navigate to the Simulation Tree. Expand the results within the Results tab. Right click on Antenna Far Field Probe. Several options will appear: Delete, Antenna Visualization, and Rename.
To generate the far field pattern, right-click the Antenna Probe result in the Simulation Tree and select Antenna Visualization.
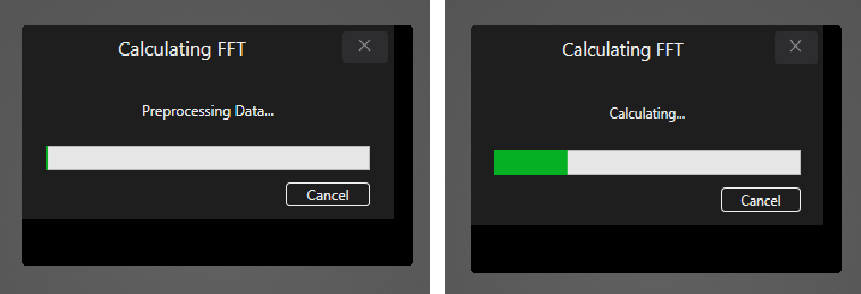
The time-domain antenna data will be processed through an FFT. The time to complete the FFT calculation can take multiple mintues depending on factors such as domain time settings and the antenna probe angular resolution.
After the FFT completes, a pop-up appears with a table of available frequencies. Type the corresponding index for the desired frequency into the text box. Remember that the antenna visualization is limited to one frequency at this time.
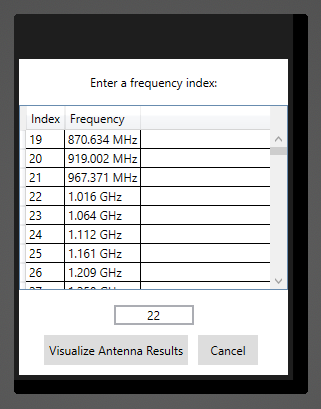
Once verified, click Visualize Antenna Results.
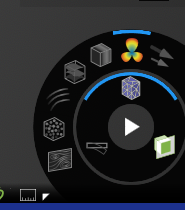
The antenna pattern is ready for visualization when the far field button
lights up in the Results Arc in the bottom-right corner of Discovery. Click the far-field button to see the antenna pattern. WARNING: The .dsco model MUST be saved with the far field button disabled. Otherwise, the model will throw a red error message on subsequent model loads. This does not impact the usability of the model but should generally be avoided.
The antenna pattern will create a visual like the one shown below.
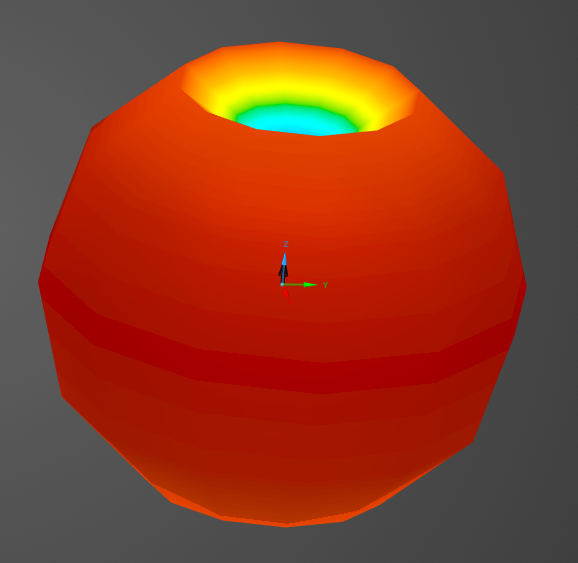
The displayed component type can be selected from the legend drop-down list.
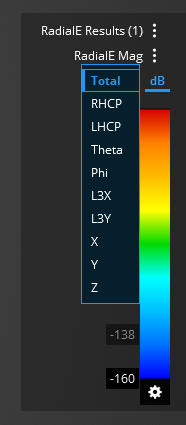
Additional visualization options are available by clicking the settings
 button in the legend.

EMA3D - © 2026 EMA, Inc. Unauthorized use, distribution, or duplication is prohibited.